
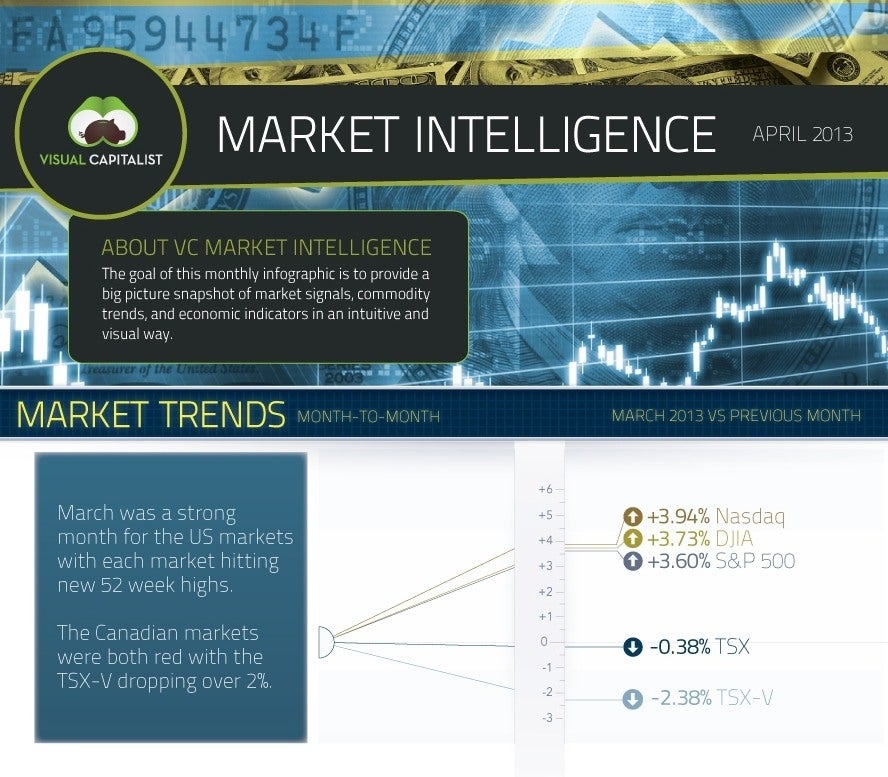
March 2013 was a particularly strong month for US markets, with each one reaching a 52 week high. Seasonal correlation comparisons for April, although not steadfast, do suggest a decline. Courtesy of Visual Capitalist, this month’s market analysis infographic draws particular insight from the rise and fall of copper. While historically copper has been a good growth indicator, a recent divergence from the SPX is raising eyebrows. Click on each image to see it full size.
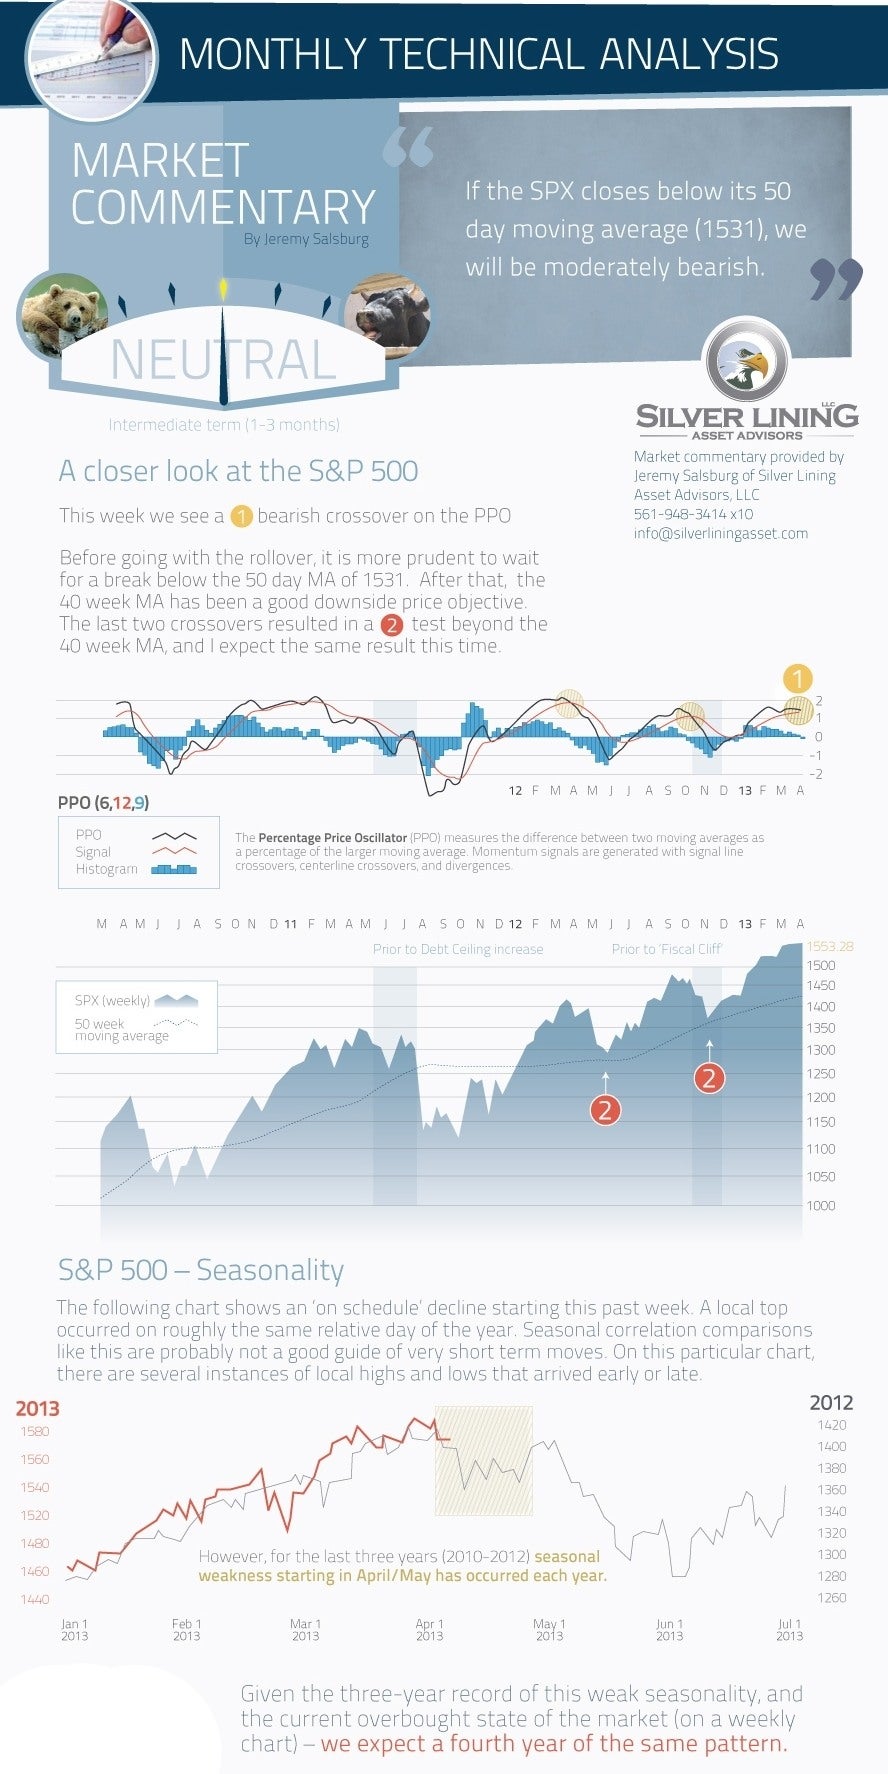
Monthly technical analysis – a closer look at the S&P 500
Jeremy Salsburg of Silver Lining Asset Advisors has commented on the S&P500 stating that, "If the SPX closes below its 50 day moving average (1531), we will be moderately bearish".
(click to see full size)
How well do you really know your competitors?
Access the most comprehensive Company Profiles on the market, powered by GlobalData. Save hours of research. Gain competitive edge.

Thank you!
Your download email will arrive shortly
Not ready to buy yet? Download a free sample
We are confident about the unique quality of our Company Profiles. However, we want you to make the most beneficial decision for your business, so we offer a free sample that you can download by submitting the below form
By GlobalData
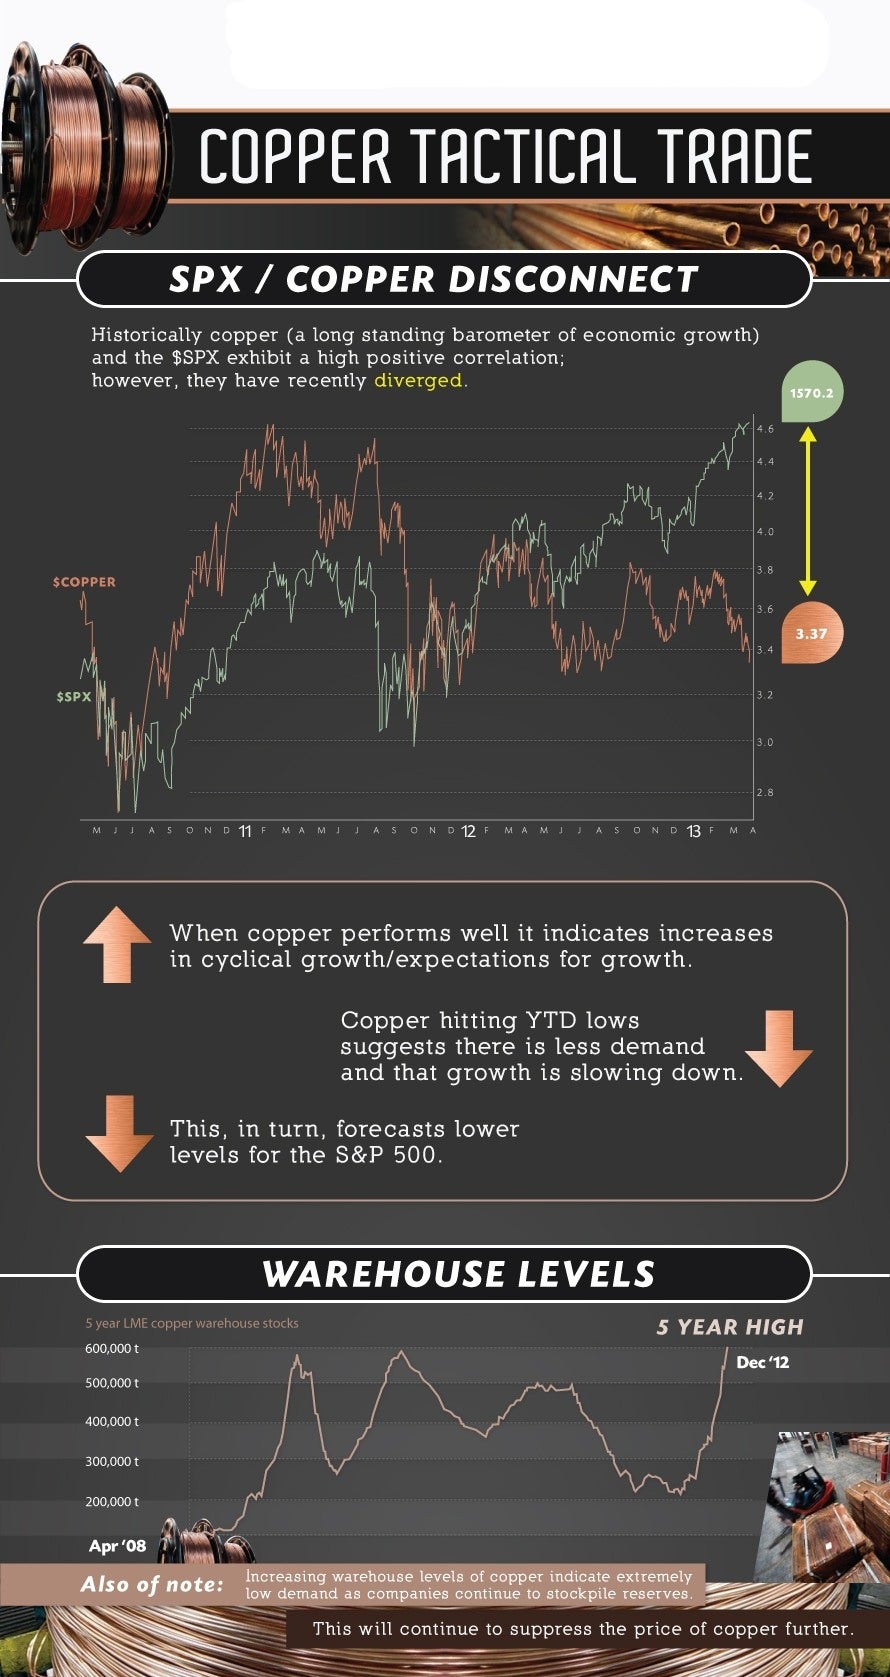
Copper tactical trade – eyes on the SPX / copper disconnect
Historically copper (a long standing barometer of economic growth) and the $SPX exhibit a high positive correlation; however, they have recently diverged. When copper performs well it indicates increases in cyclical growth or expectations for growth. Copper hitting YTD lows suggests there is less demand and that growth is slowing down, which in turn forecasts lower levels for the S&P 500.
Additionally, increasing warehouse levels of copper indicate extremely low demand as companies continue to stockpile reserves, which will continue to suppress the price of copper further.
(click to see full size)
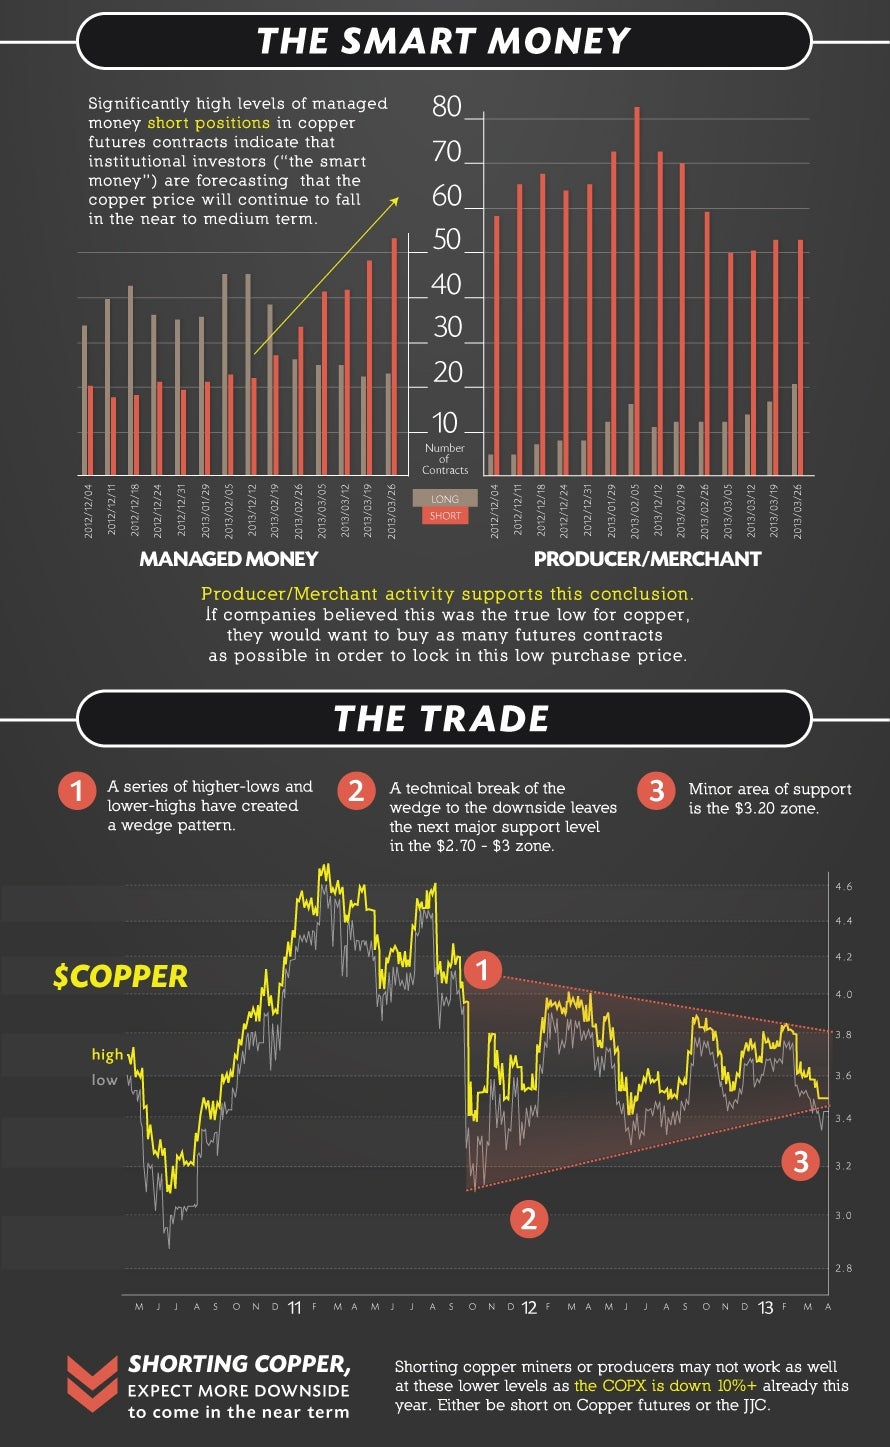
The smart money – investors predict a fall in copper prices this April
Significantly high levels of managed money short positions in copper futures contracts indicate that institutional investors are forecasting that the copper price will continue to fall in the near to medium term. Producer / merchant activity supports this conclusion. If companies believed this was the true low for copper they would want to buy as many futures as possible in order to lock in this low purchase price.
(click to see full size)
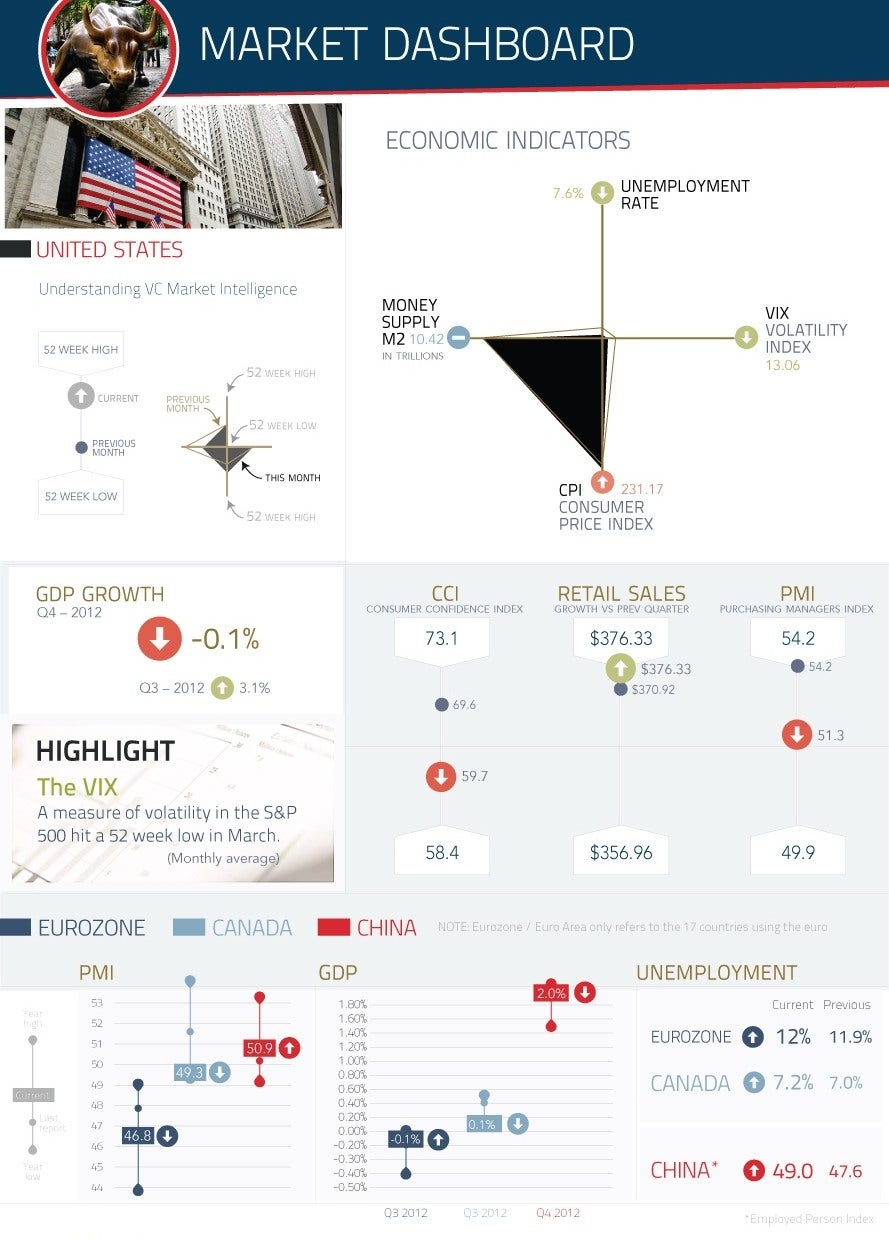
Market dashboard – a close look at your economic indicators
(click to see full size)
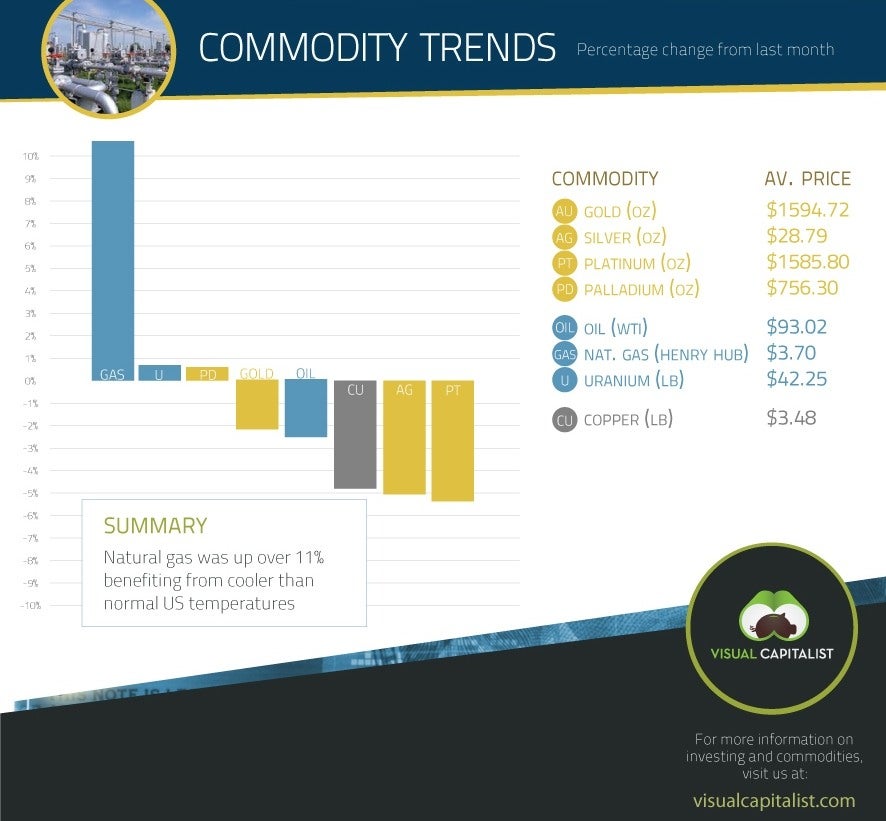
Commodity trends – the commodities percentage change over the month before
(click to see full size)
Related content
Infographic – counting the cost of comminution
As high grade ores stocks dwindle, the need to divest more energy in the pursuit of profits is wreaking havoc on company bottom lines.
Mining lookout: trends to watch in 2013
Low commodity prices and high operating costs dented mining profits last year, but is business set to improve in 2013?


.gif)

